top of page

Background
ARIMANS is a car rental/leasing company. The company employs dozens of drivers across the country, who are responsible for various tasks such as: transferring vehicles for inspection, delivering vehicles to customers, taking vehicles to the garage, and so on.
This system was developed to manage the entire operation, including adding new drivers to the company, creating new tasks, linking drivers to tasks, maintaining an organized work schedule, providing a map that displays all relevant data, and featuring a dashboard that summarizes and presents all data on a daily basis.
Until now, there was no organized system for this. I received a Word document summarizing all the necessary details and data required for the system, and I was tasked with design and characterize it from scratch.
Workflow

Learning

Research

Specification, Design and User Testing
1. Learning
First, I studied complex systems with extensive data sets, reviewed numerous examples and inspirations, until I formed a clear picture in my mind of a structured and intricate system.
2. Research
I conducted field research to understand the current operations, including the tasks assigned to drivers, how they receive these tasks, how managers create new tasks, and how tasks are assigned to drivers. I assessed what is most important to them, what aspects they prefer not to change, and which elements are problematic and need to be improved, among other factors. This thorough investigation provided me with the necessary knowledge and data for developing the system.
3. Specification, Design, and User Testing
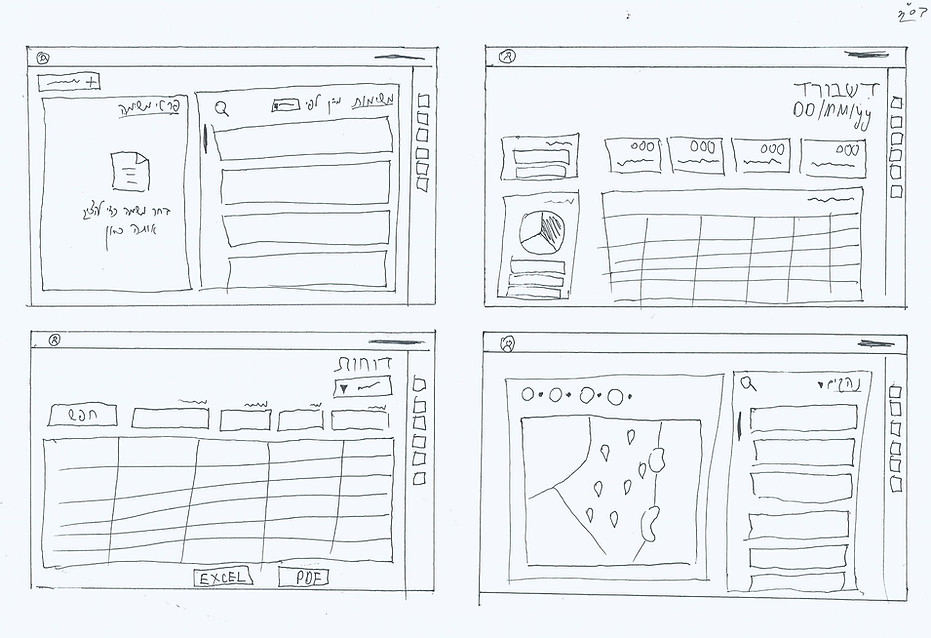
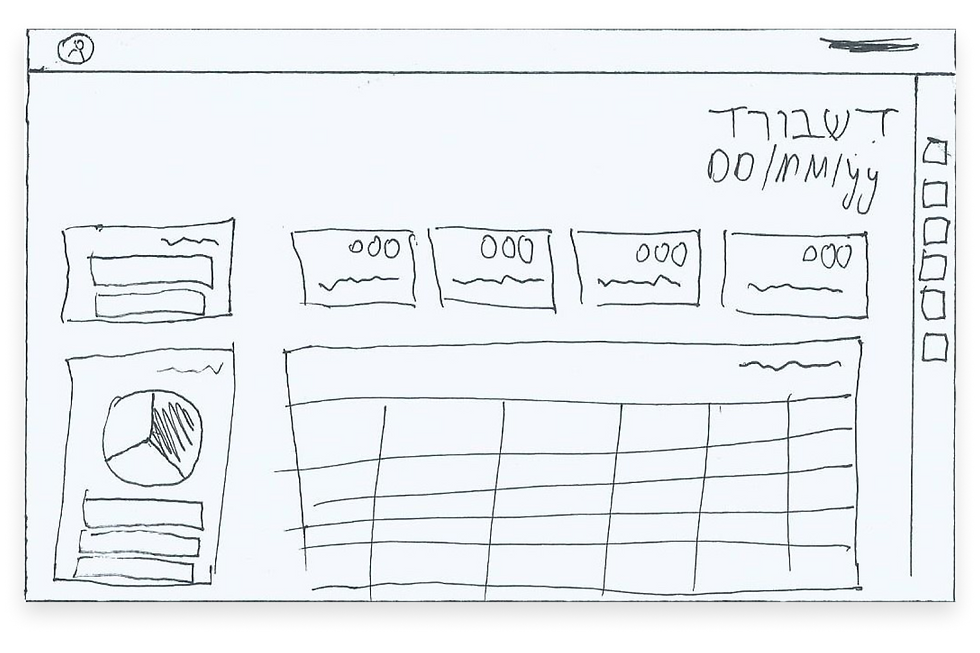
I proceeded to define the system's screens, starting with manual sketches.
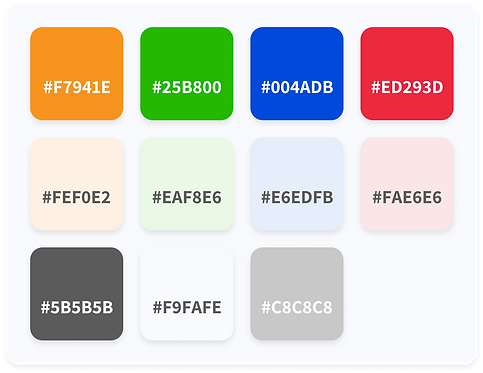
Colors
Logo

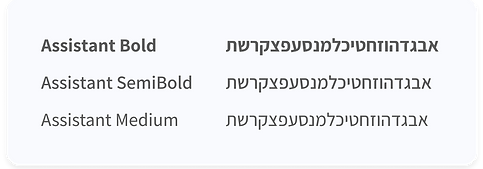
Fonts
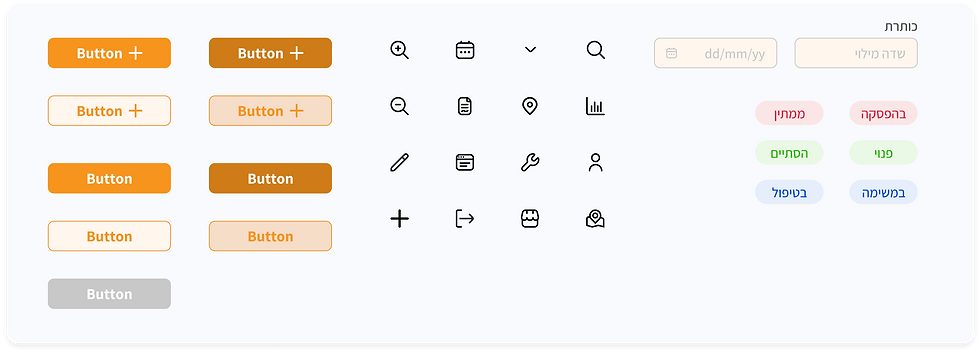
Ui kit
.png)
Example screens
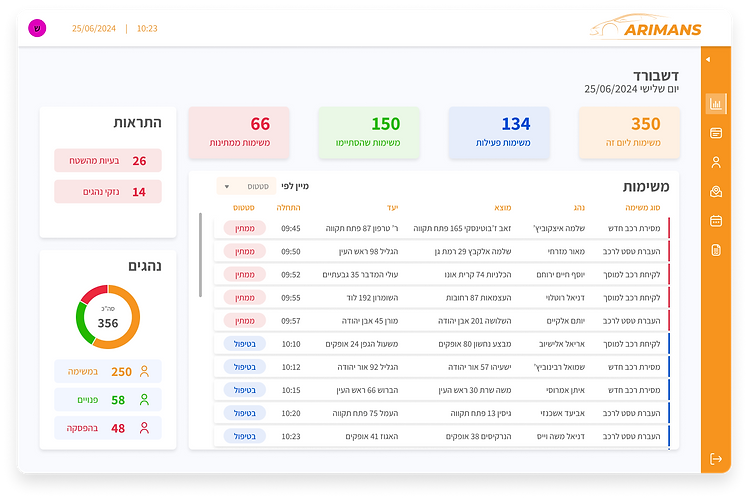
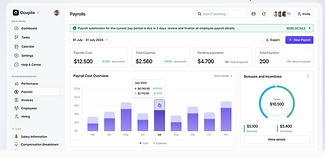
A dashboard screen, displays all relevant data in real-time, clearly in front of you, and allows managers to easily keep track of everything that's happening.

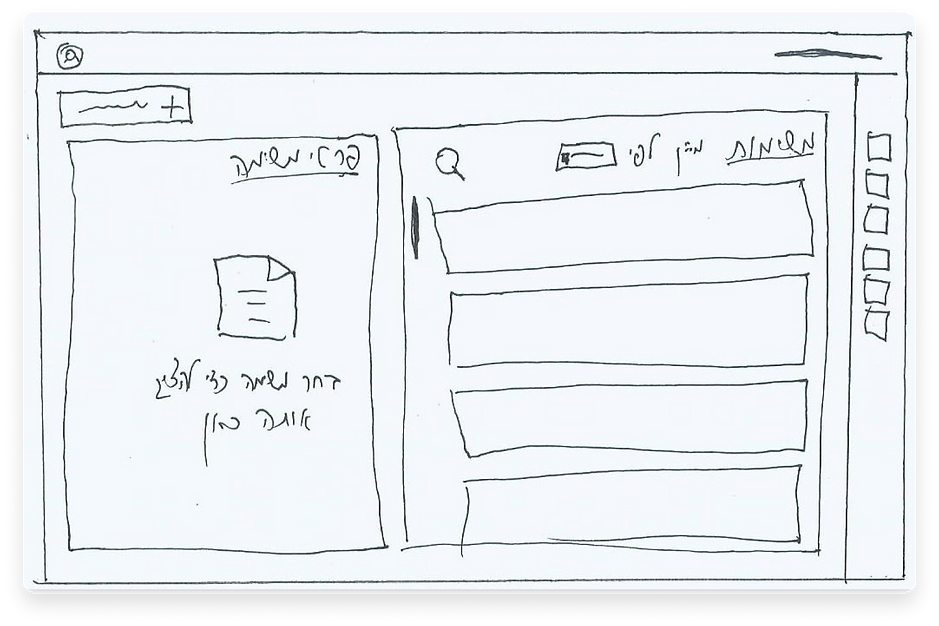
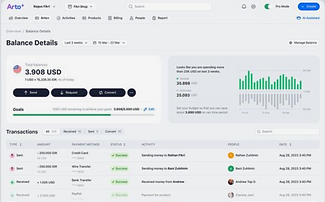
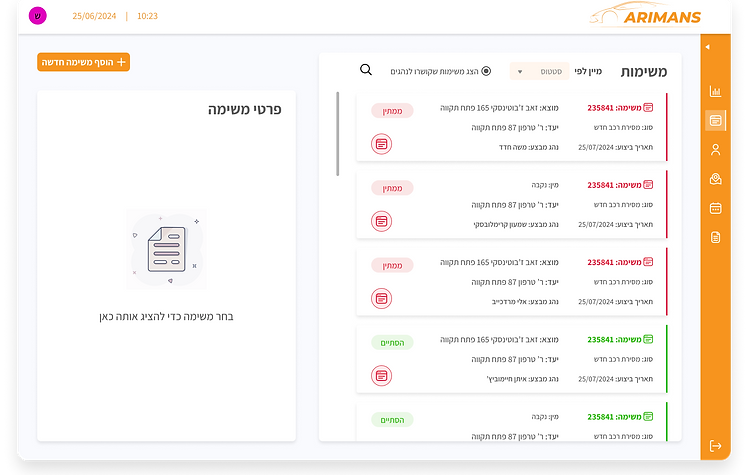
A task screen, displays all tasks, with the option to sort them by task status, task date, task location, task type, and also allows for adding new tasks.

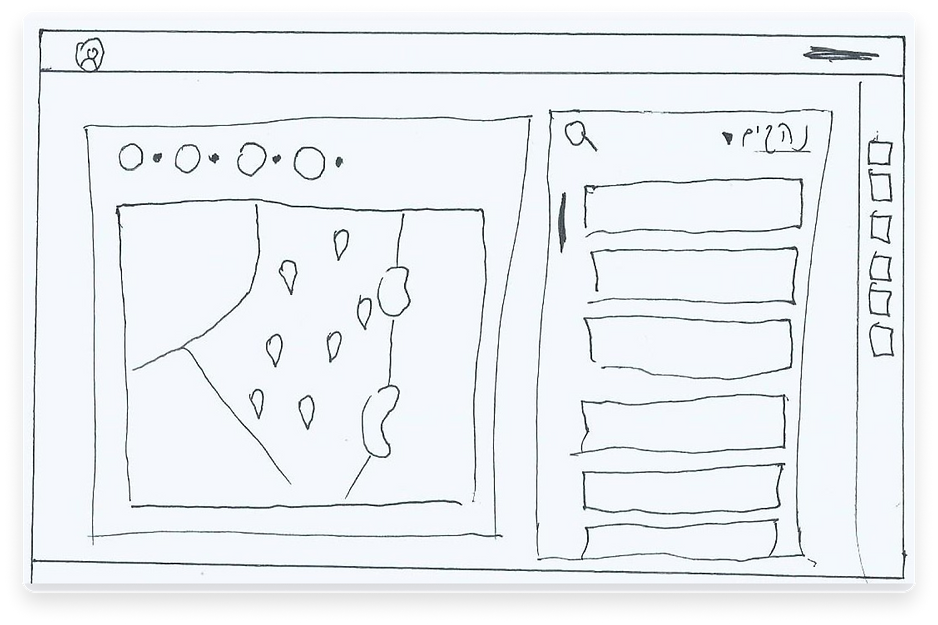
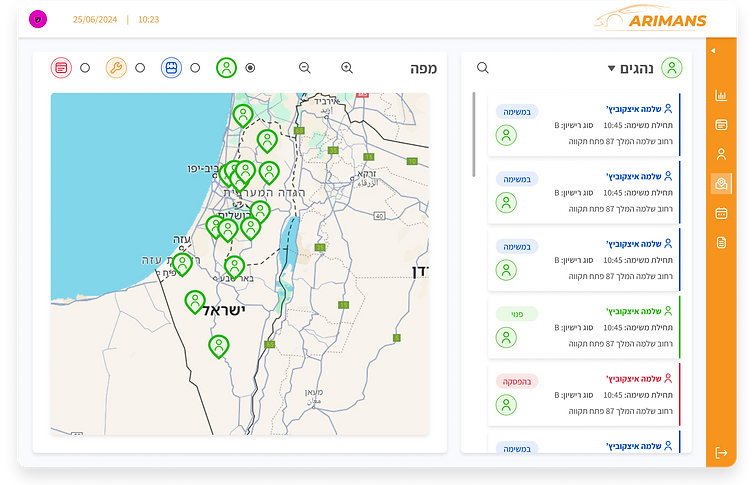
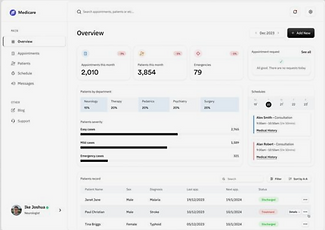
A map screen displays a map of Israel, with the option to show: drivers, tasks, garages, and branches. For example, if you choose to display drivers, it shows all drivers on the map according to their location, and a list on the side shows the details and status of each driver.
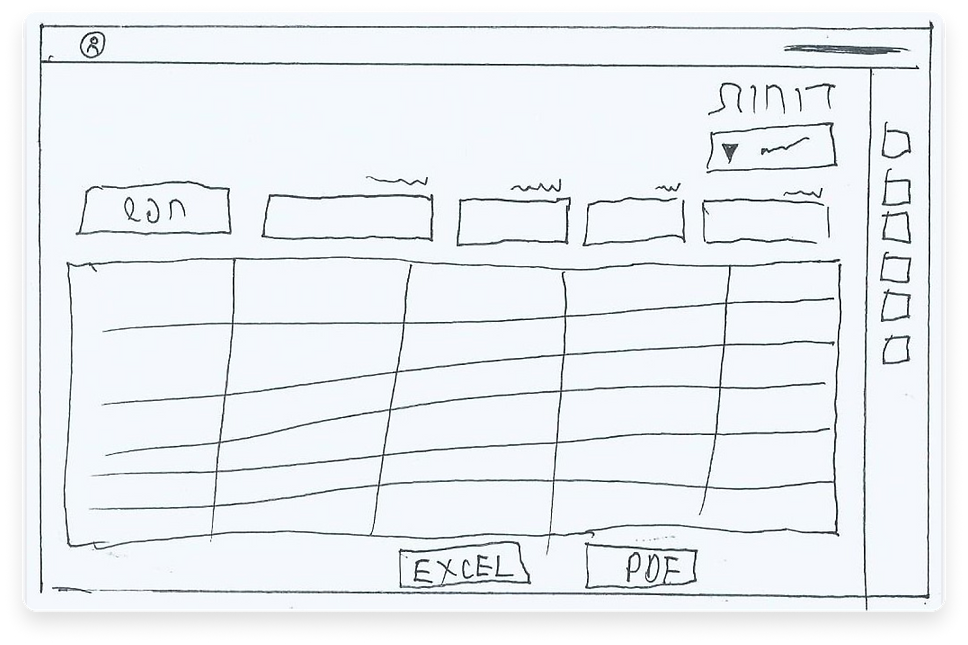
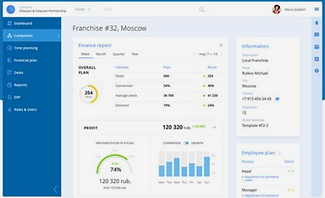
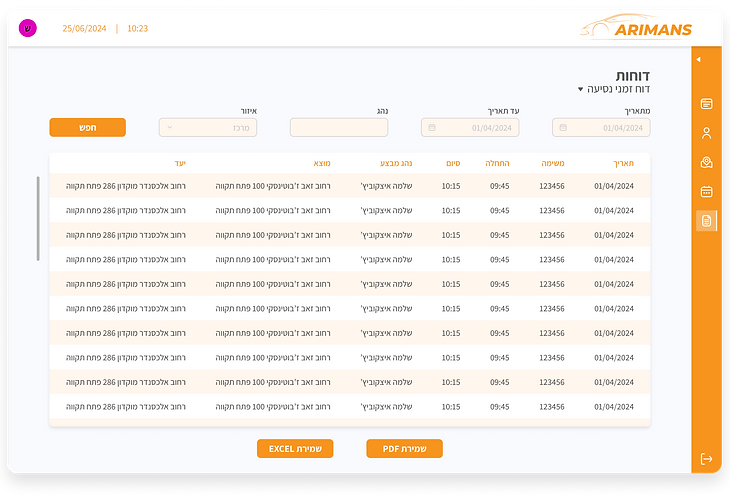
A reports screen contains all the reports generated during work. You can select the type of report you want to display, with suitable filtering options, and save the report as a PDF or EXCEL file.


bottom of page